If you're a PC gamer, you know the value of performance metrics. These graphs and charts overlaid on top of a game give you real-time information about how well your system performs. And for the first time, Galaxy users running One UI 3.0 will get access to similar information for mobile games.
In Samsung's Android 11 update, there is a hidden feature that gives you these PC gaming style metrics. Once enabled, you see how well (or poorly) your Galaxy smartphone is handing a particular game or app. You can see FPS, the load on the CPU and GPU, and much more. And with this information, you can customize the gaming experience for maximum graphics and frame rate.
Unlock Developer Options
This secret feature can be found in the hidden Developer Options menu. To unhide this option, you will need to open the Settings app and head into "About Phone," then select "Software Information." Here, tap on "Build number" seven times in rapid succession, then you'll be asked for your lock screen password, PIN, or gesture. After inputting this information, return to the Settings app's main page, and below "About phone" is the now-activated "Developer Options."
Enable the GPUWatch Overlay
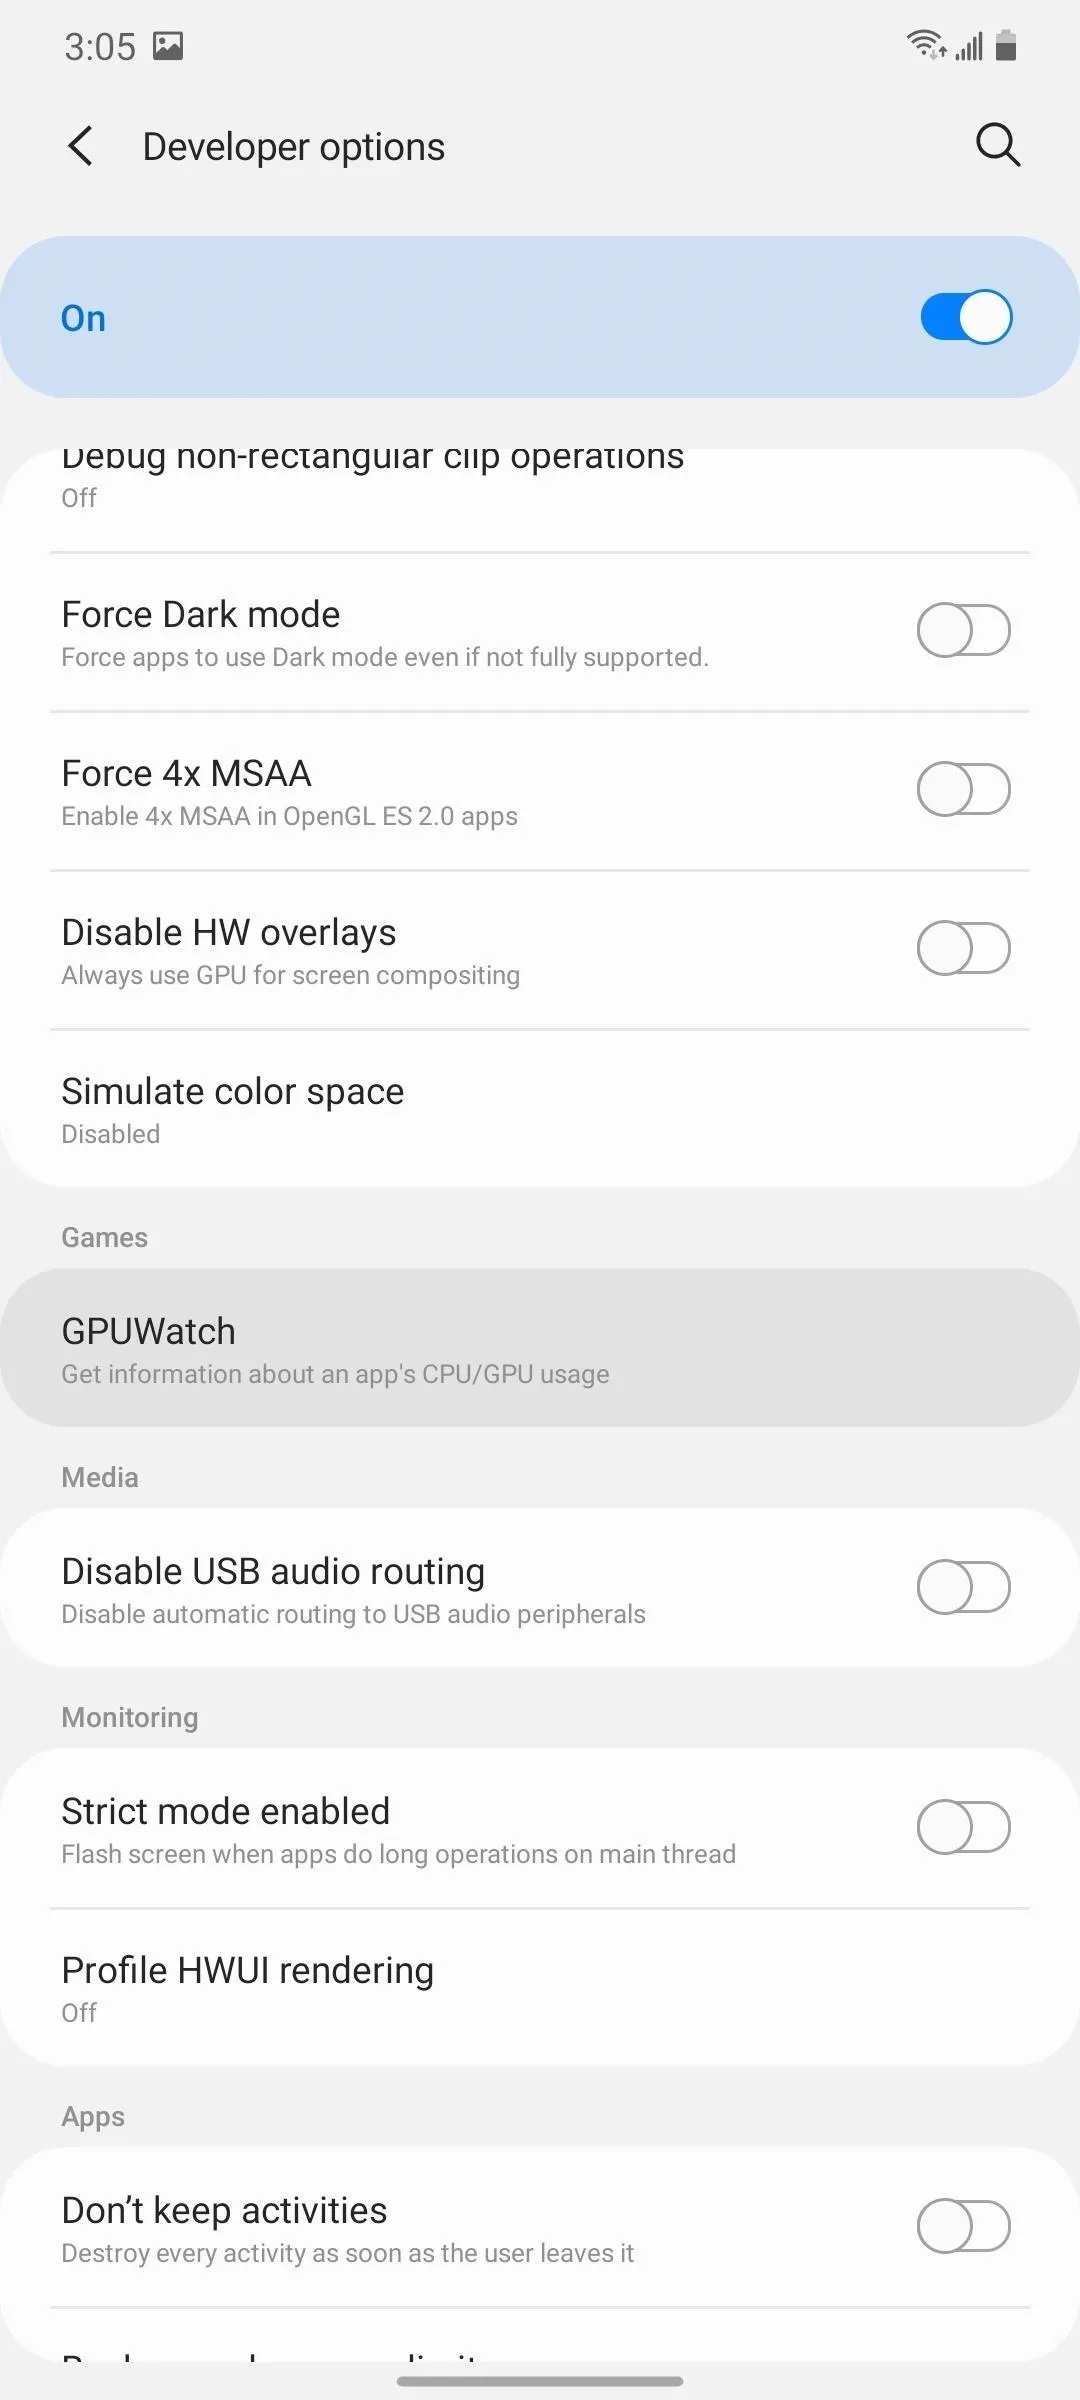
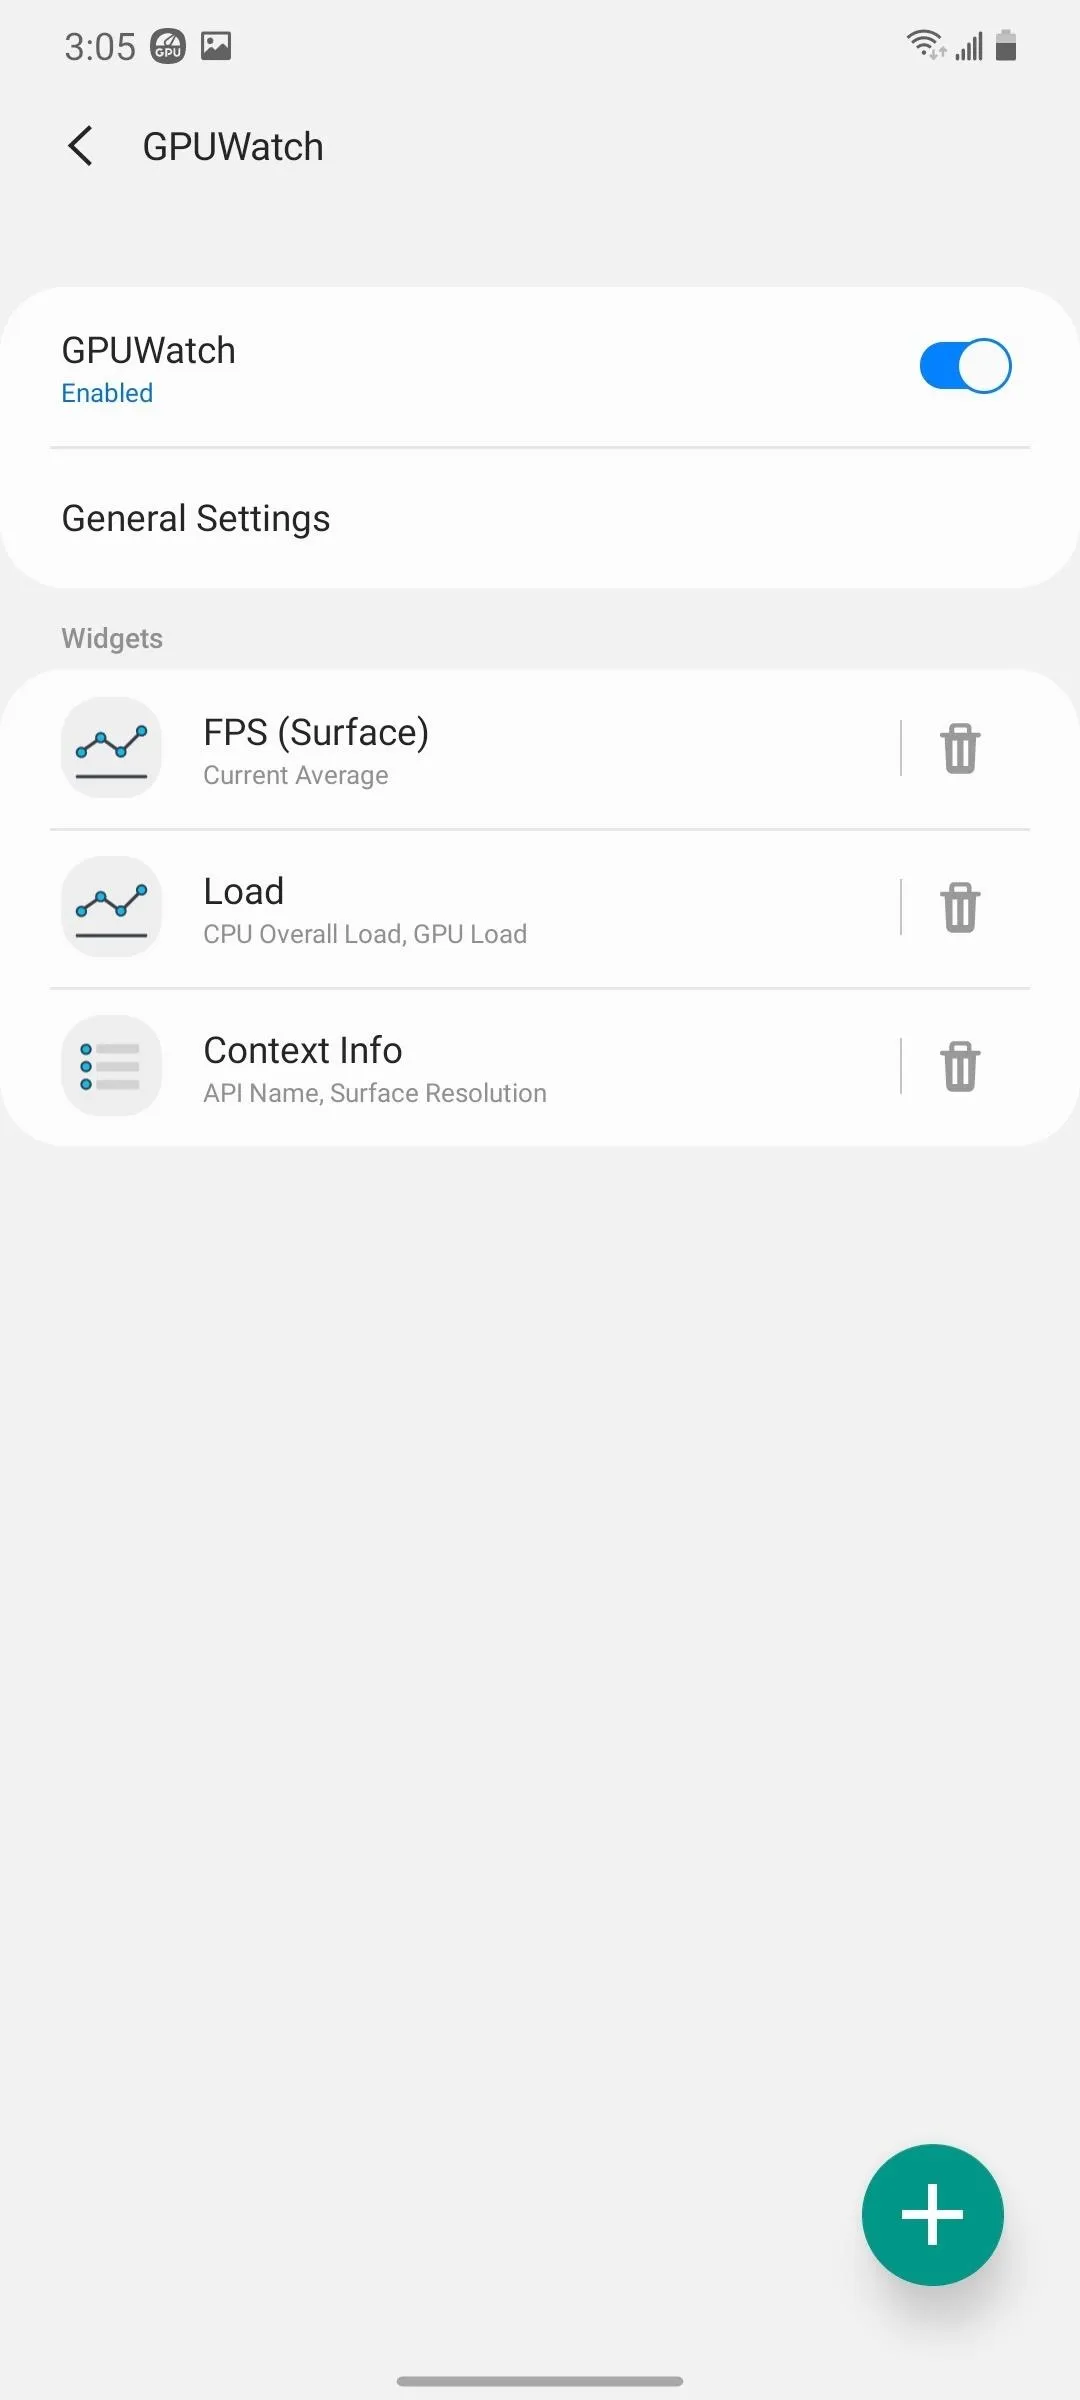
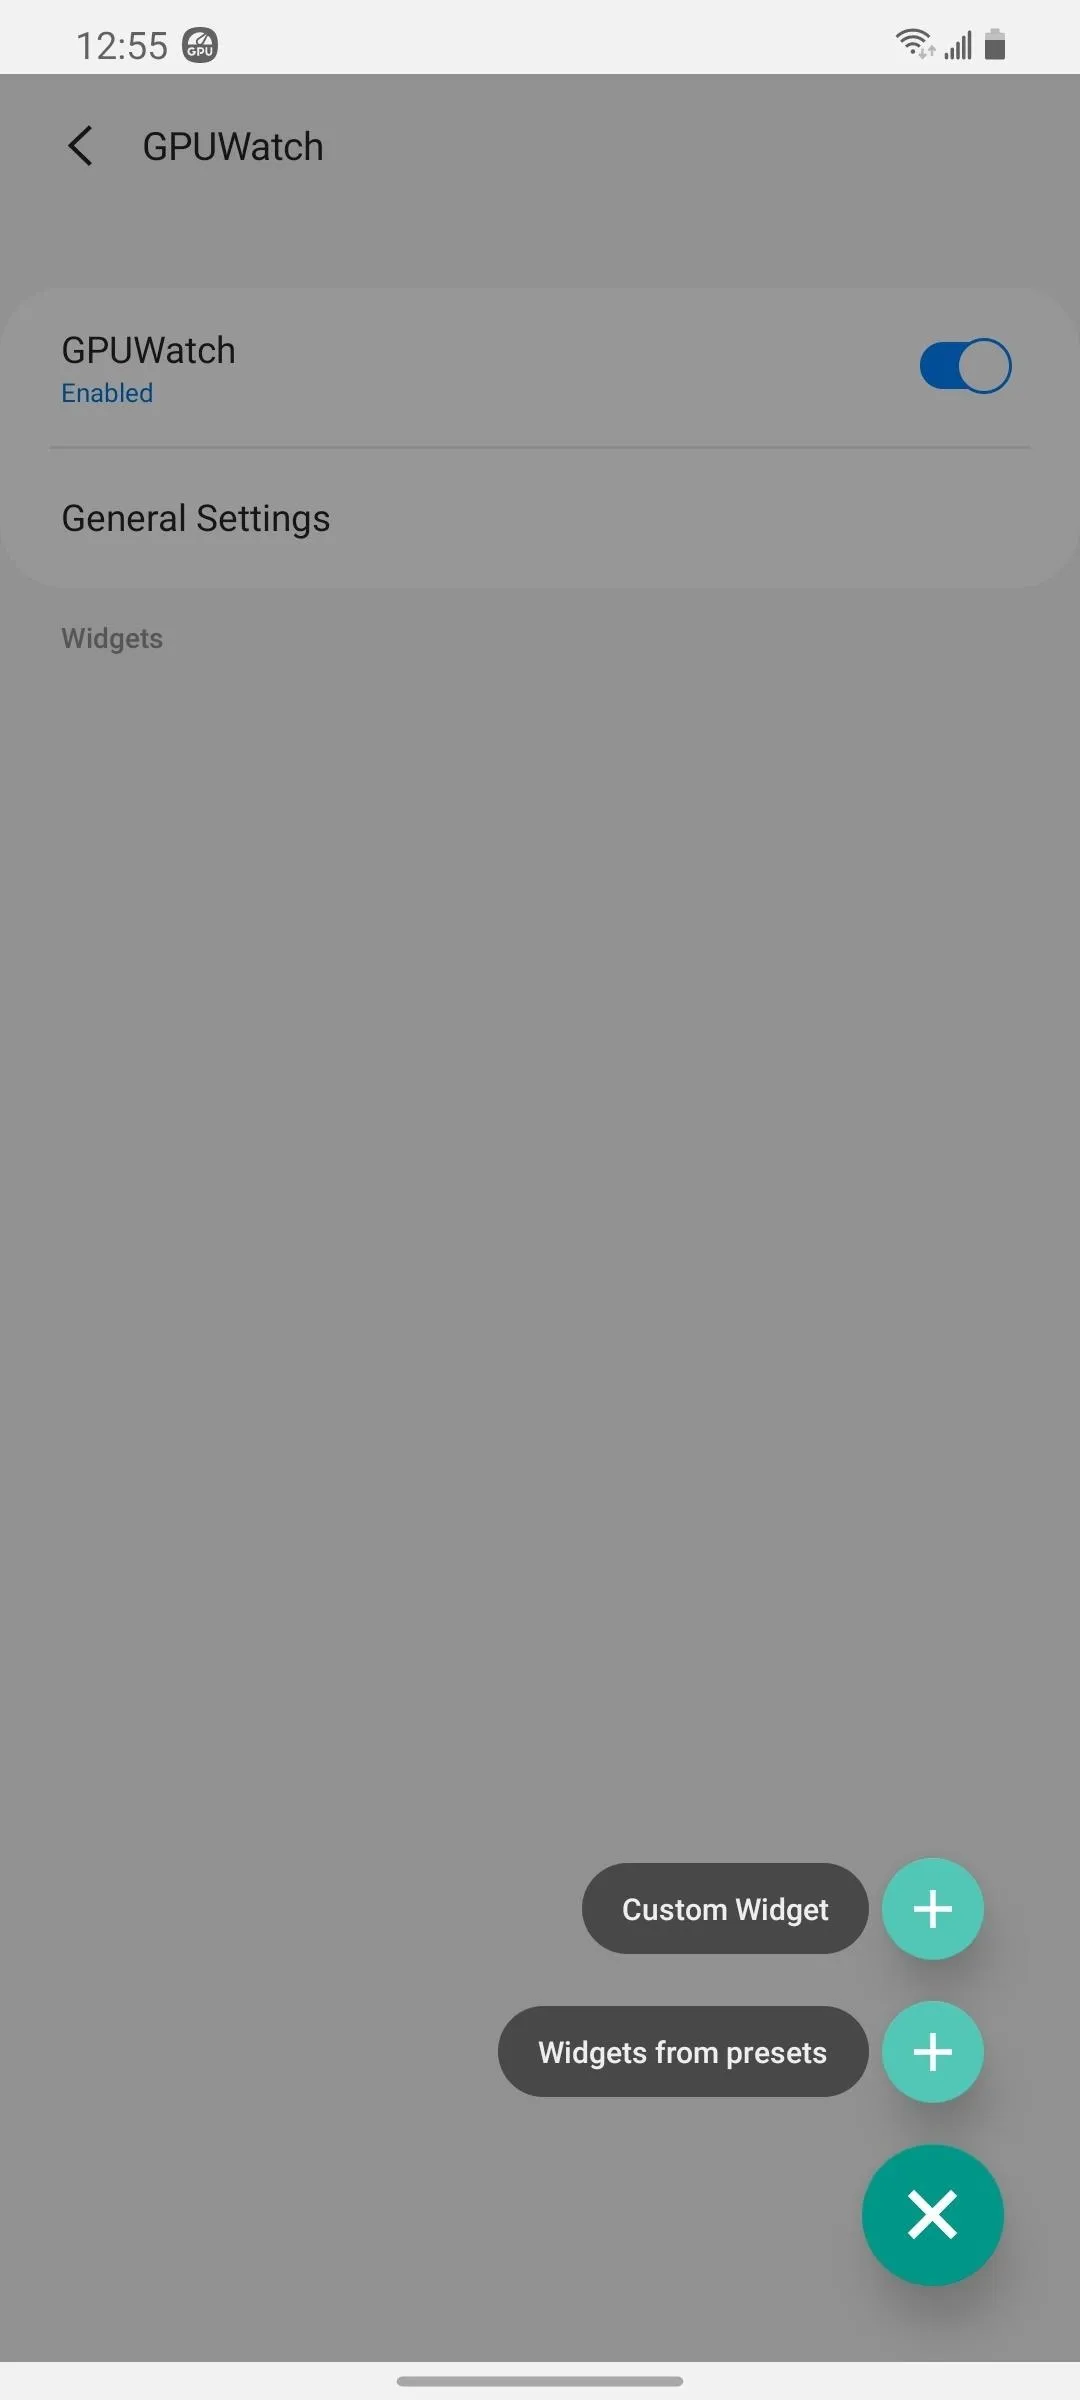
With Developer Options unlocked, open the new menu and scroll way down to the Games section. It's just below the Hardware accelerated rendering section. Here, select "GPUWatch." Enable the toggle on the next page to add the metrics.


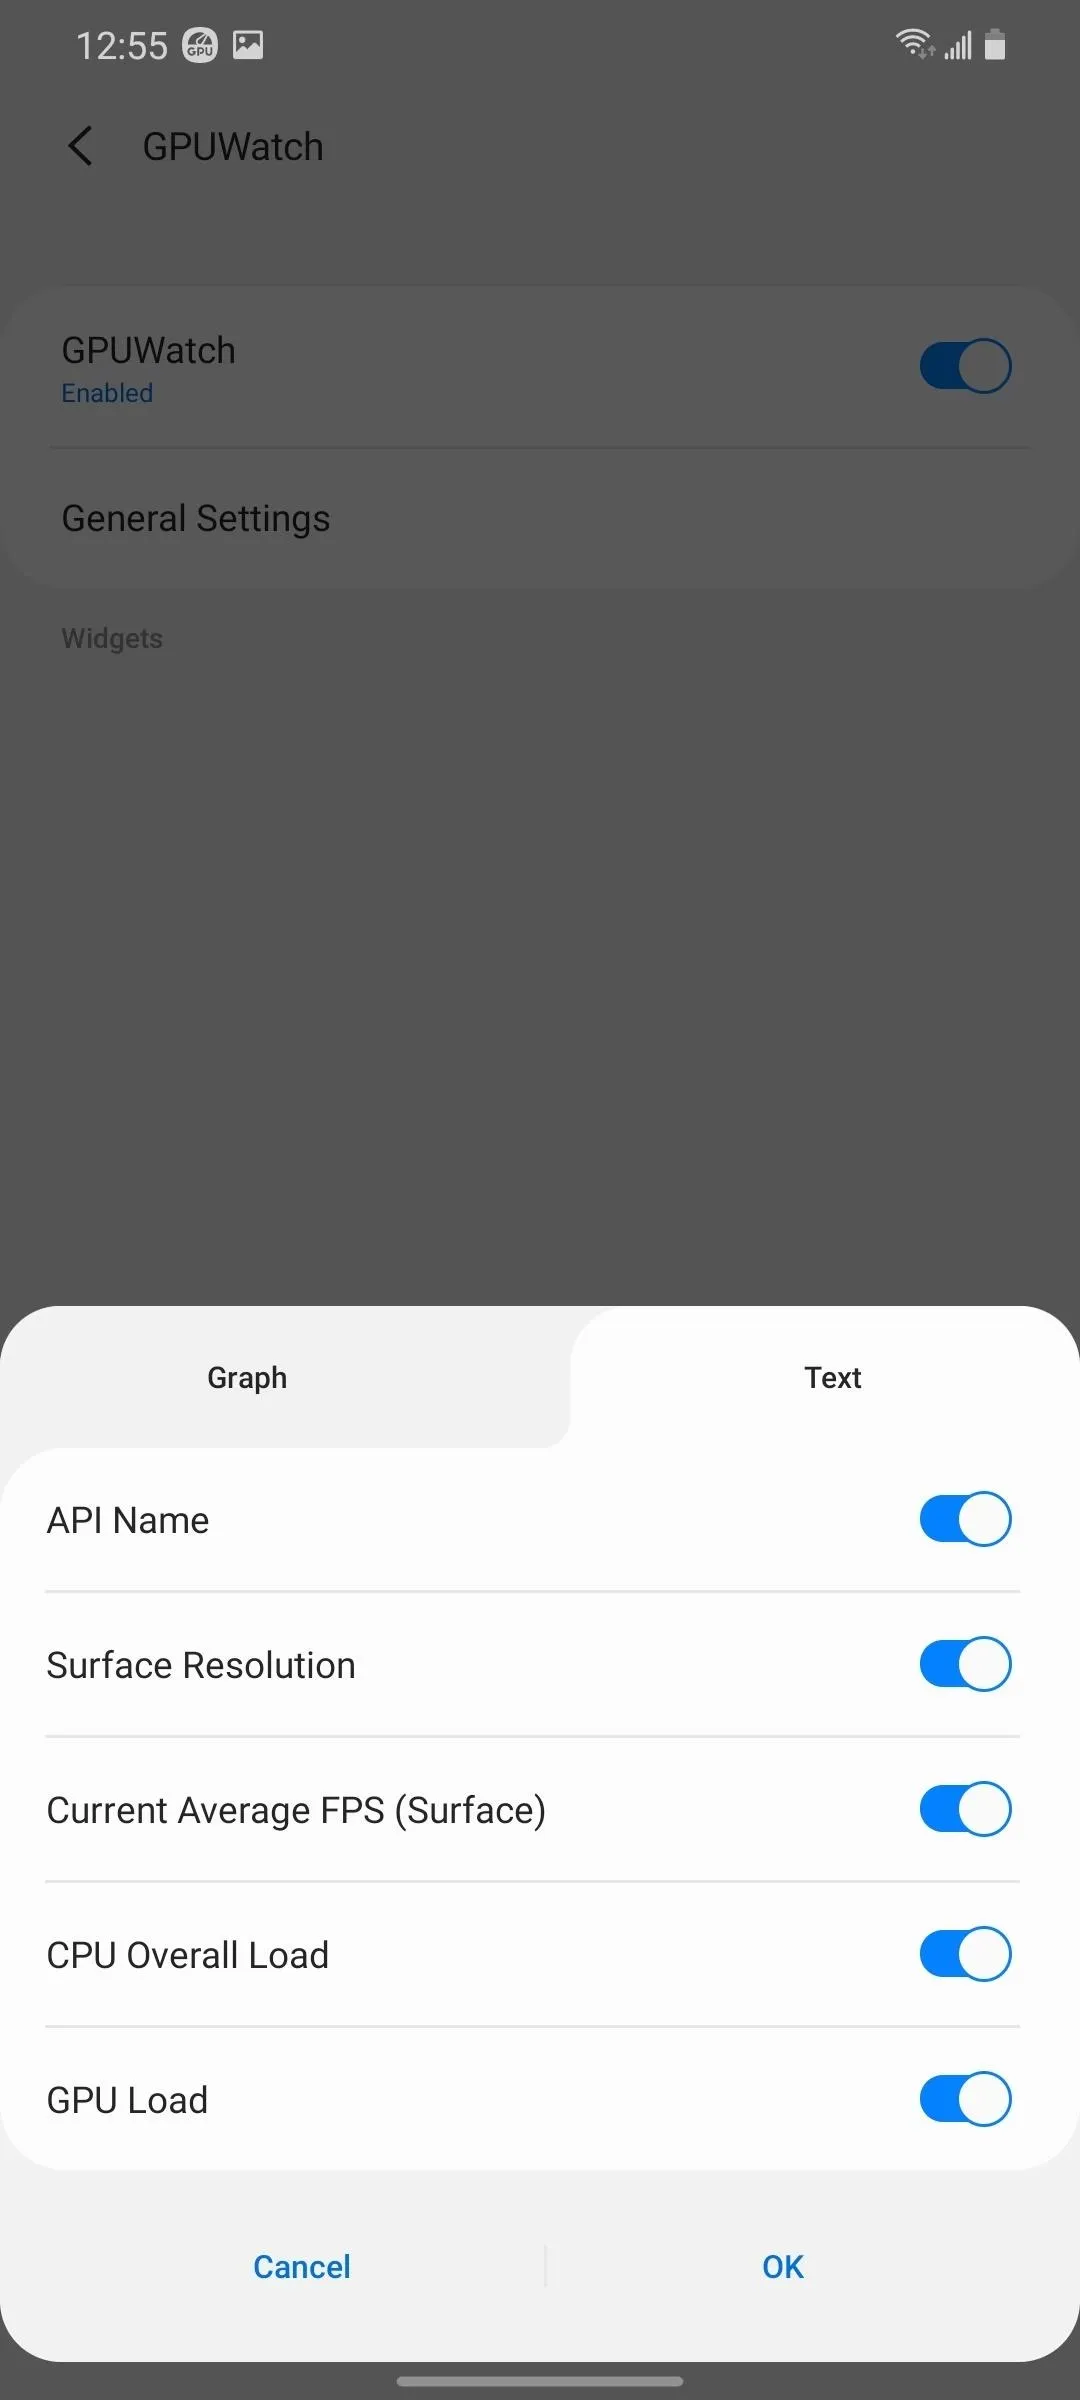
GPUWatch is capable of is displaying the following information:
- API Name: The graphical interface used by the game, which has a big impact on performance.
- Surface Resolution: The resolution the game is output. This can be different from your screen resolution.
- Current Average FPS (Surface): The frame per second the game is generating.
- CPU Overall Load: The percentage of CPU processing power currently being used.
- GPU Load: The percentage of GPU processing power currently being used.
FPS, CPU Load, GPU Load are the only metrics that can be displayed as a line graph. However, all five options can be listed in text form. By default, you will have three widgets: FPS as a line graph, CPU and GPU Load as a line graph, and both API Name and Surface Resolution as text.
Customize the Metrics
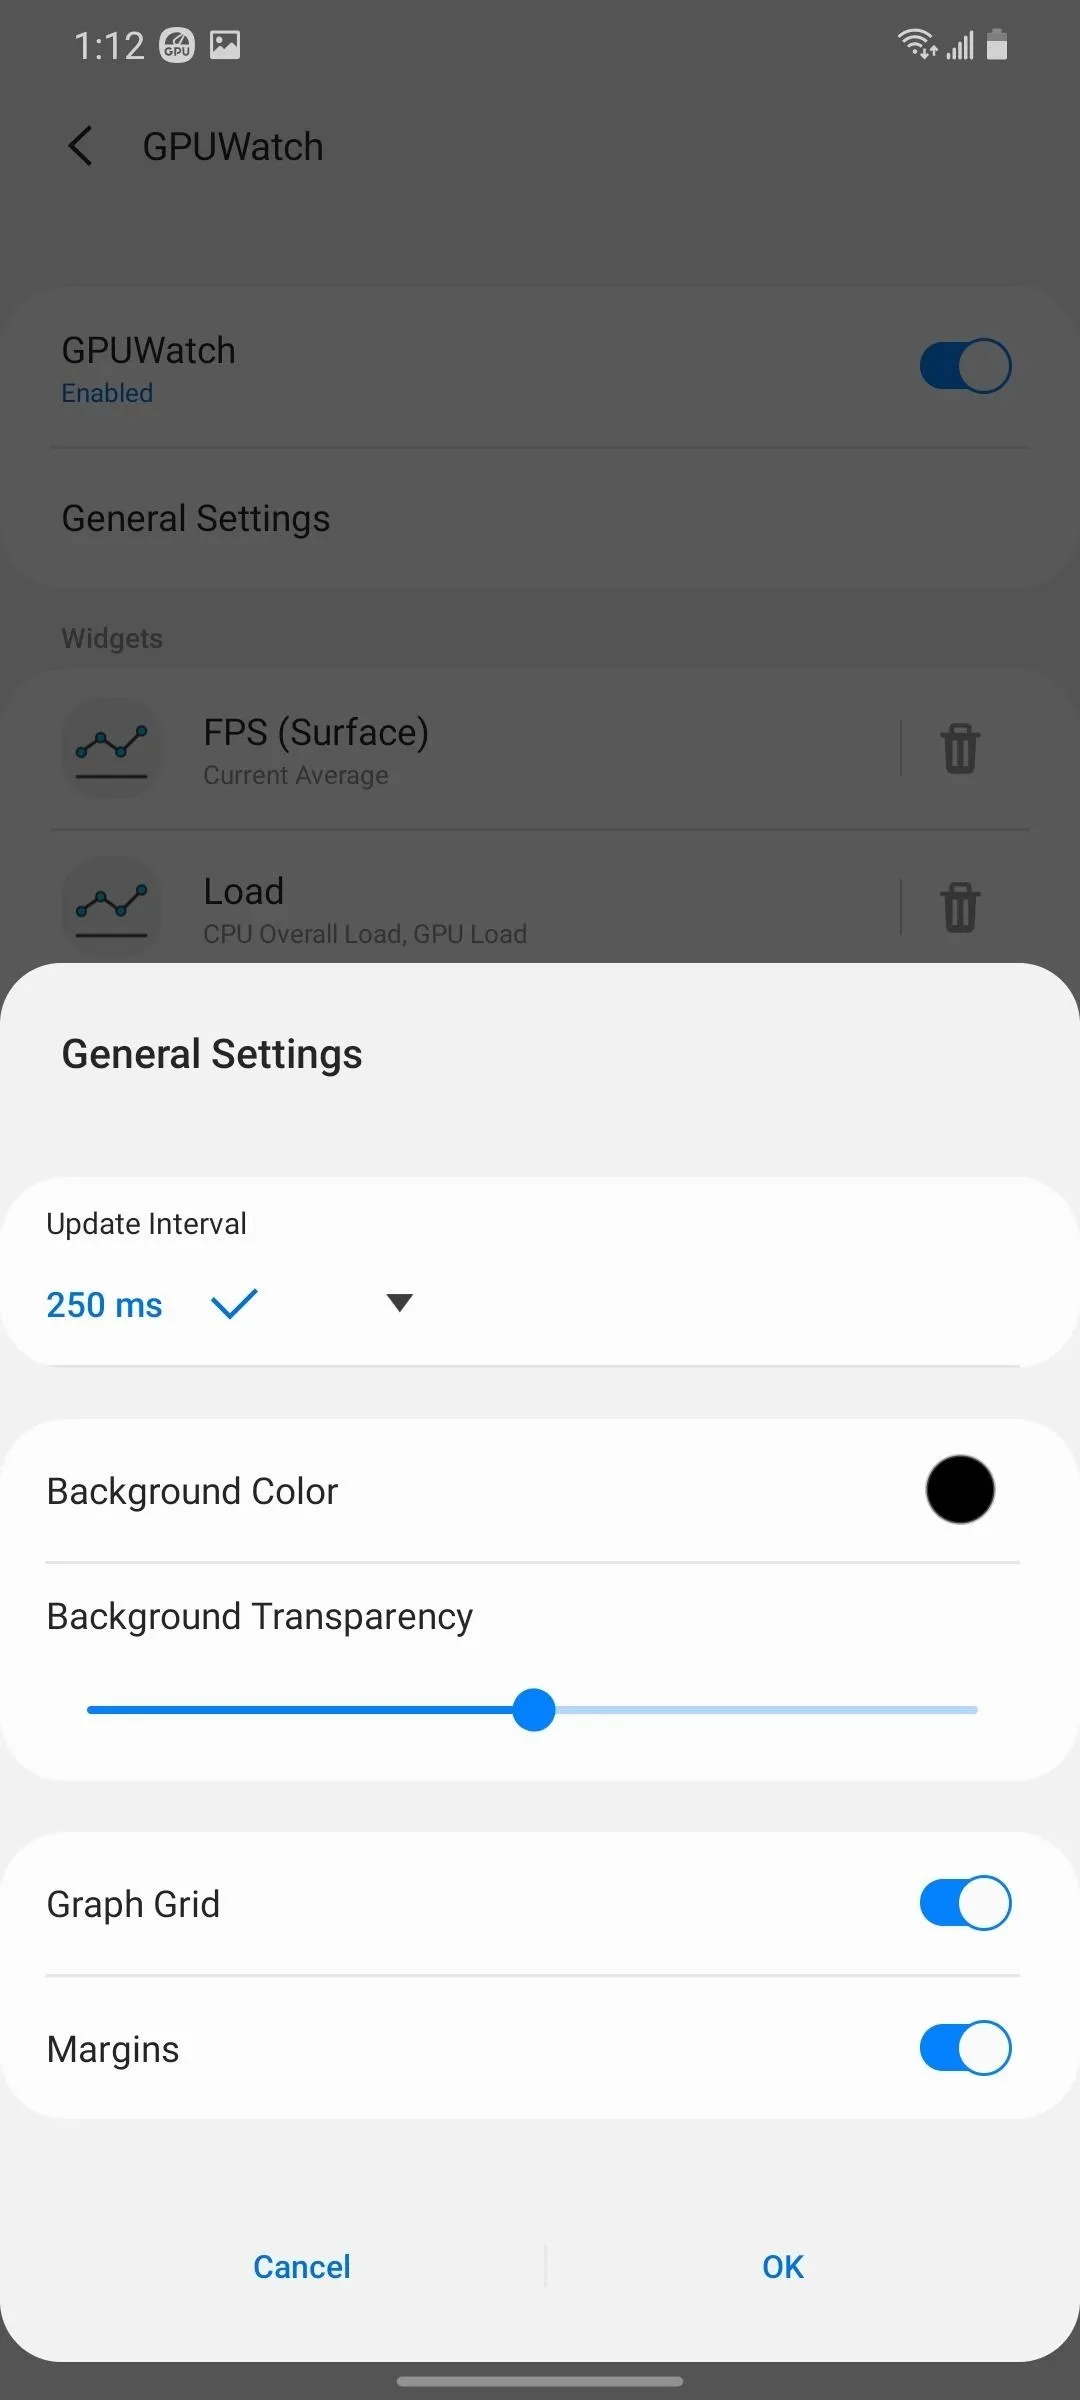
The three widgets give all the information you need, but there are several ways you can modify the experience to your preference. First, select "General Settings" and choose the drop menu under "Update Interval" if you want to change how frequently the data is updated.
The next two sections control the look of the widgets. You can adjust the background color (and its transparency), among other options.
Back on the main page, you can select individual widgets to customize how they appear. You can increase their size, rename them, include or remove its legend, and adjust the graph's color.
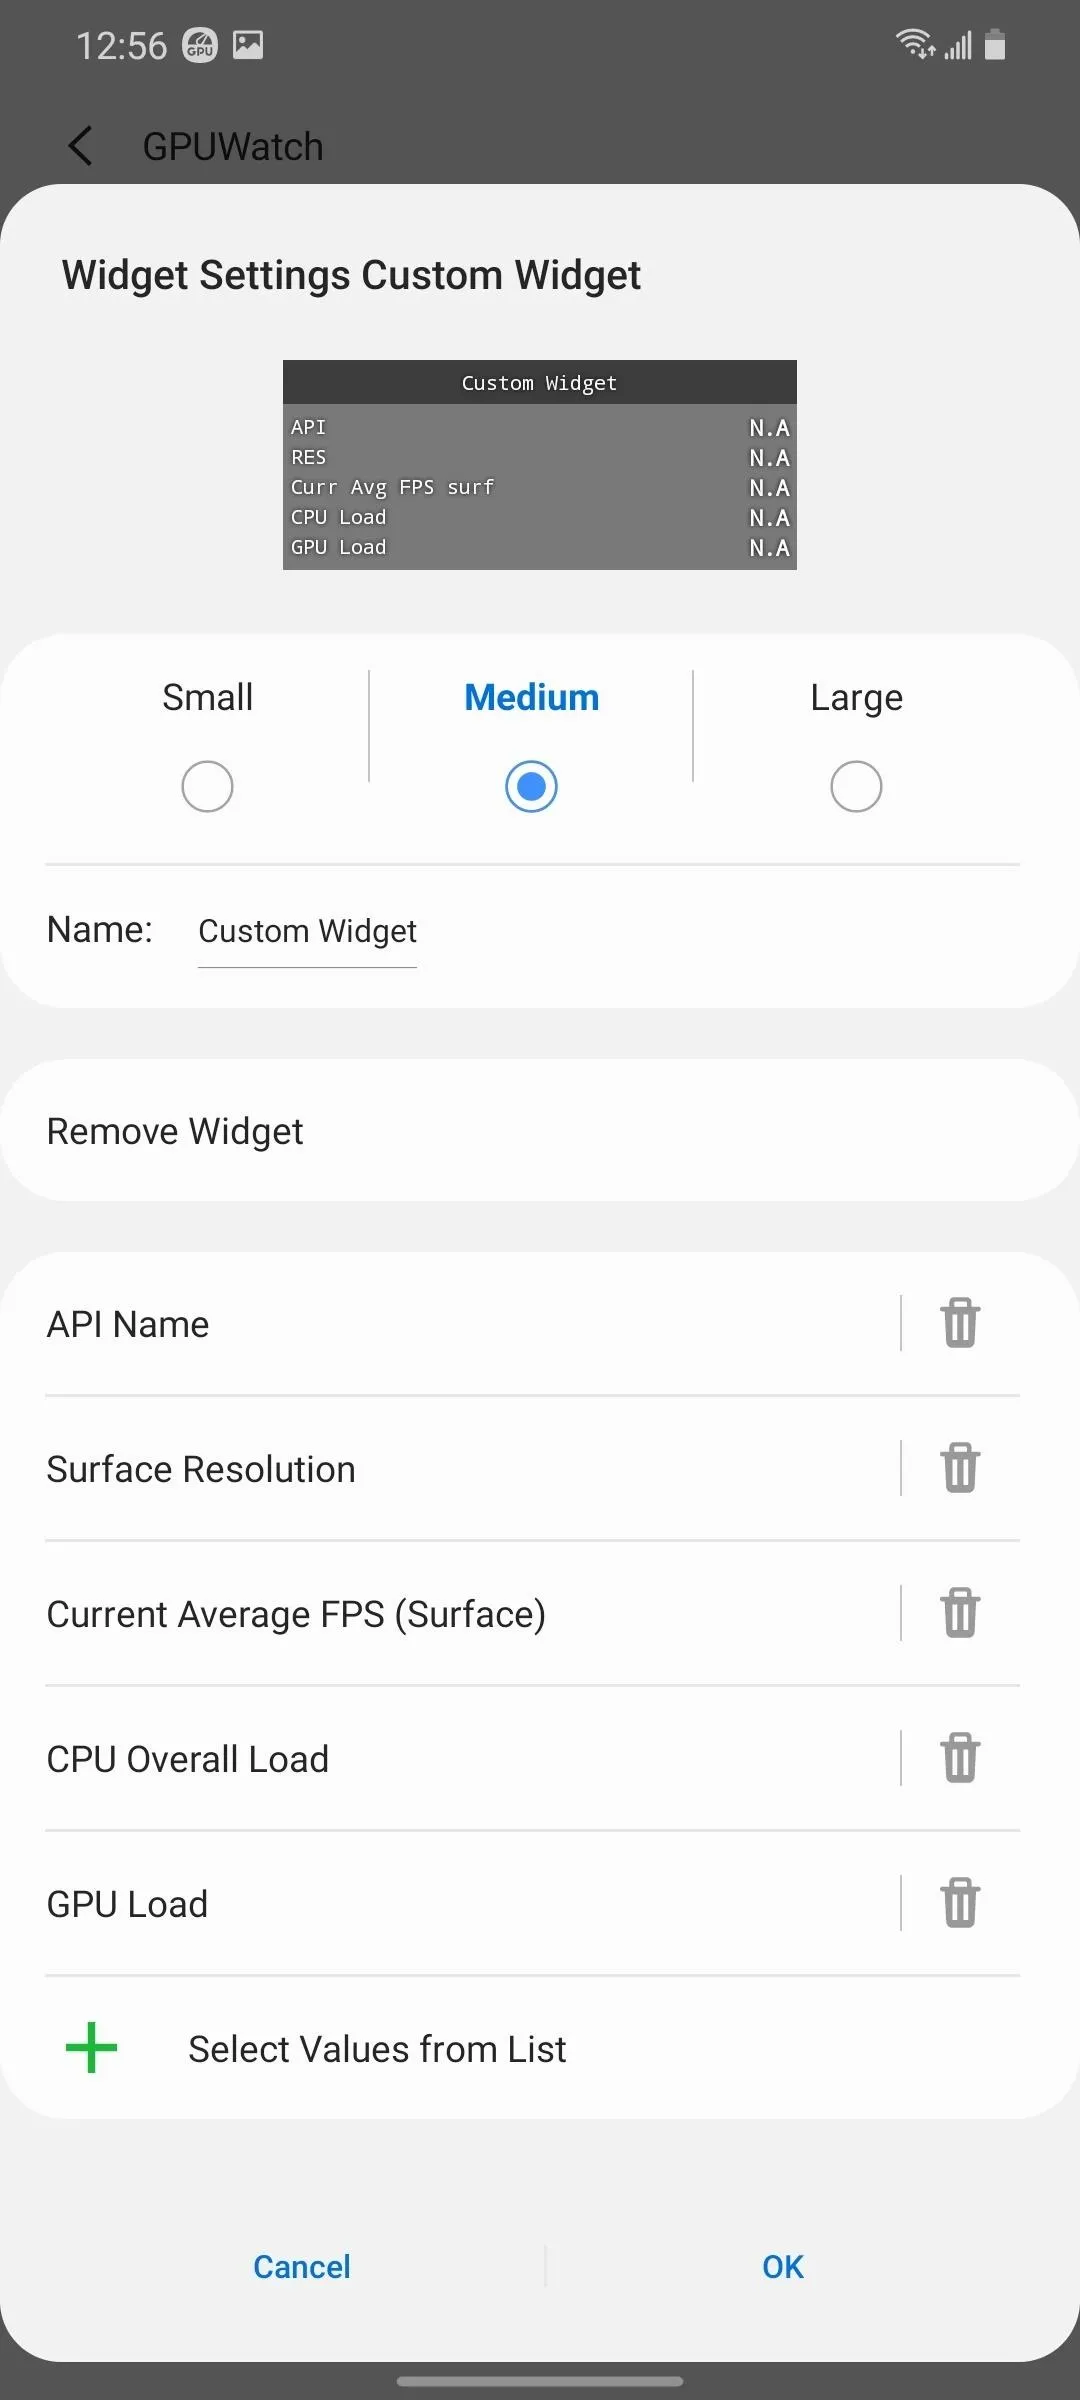


Use the floating action button to add a widget, either from presets or custom. With presets, the data grouped together by default will be added together. For example, CPU and GPU Load can be paired with FPS in one widget, but not FPS and CPU Load. Custom widgets eliminate this restriction.
Finally, there are a few additional options in the notification shade. Select "Unlock Widget" to the move around the position of widgets. Choose "Hide Widgets" if you don't want to see the graph but want to keep readily available.


See Performance Metrics for Your Games
Now that you have GPUWatch enabled and customized to your liking, opening a game and observe the data. With this information, you can adjust how you play and what games you play.
For example, if you're not sure if the game supports 120 fps, use GPUWatch to check. Does your phone feel slow when you play this game? Check the CPU and GPU Load. You can also monitor the impact of specific APIs on your SoC, such as OpenGL vs. Vulkan.
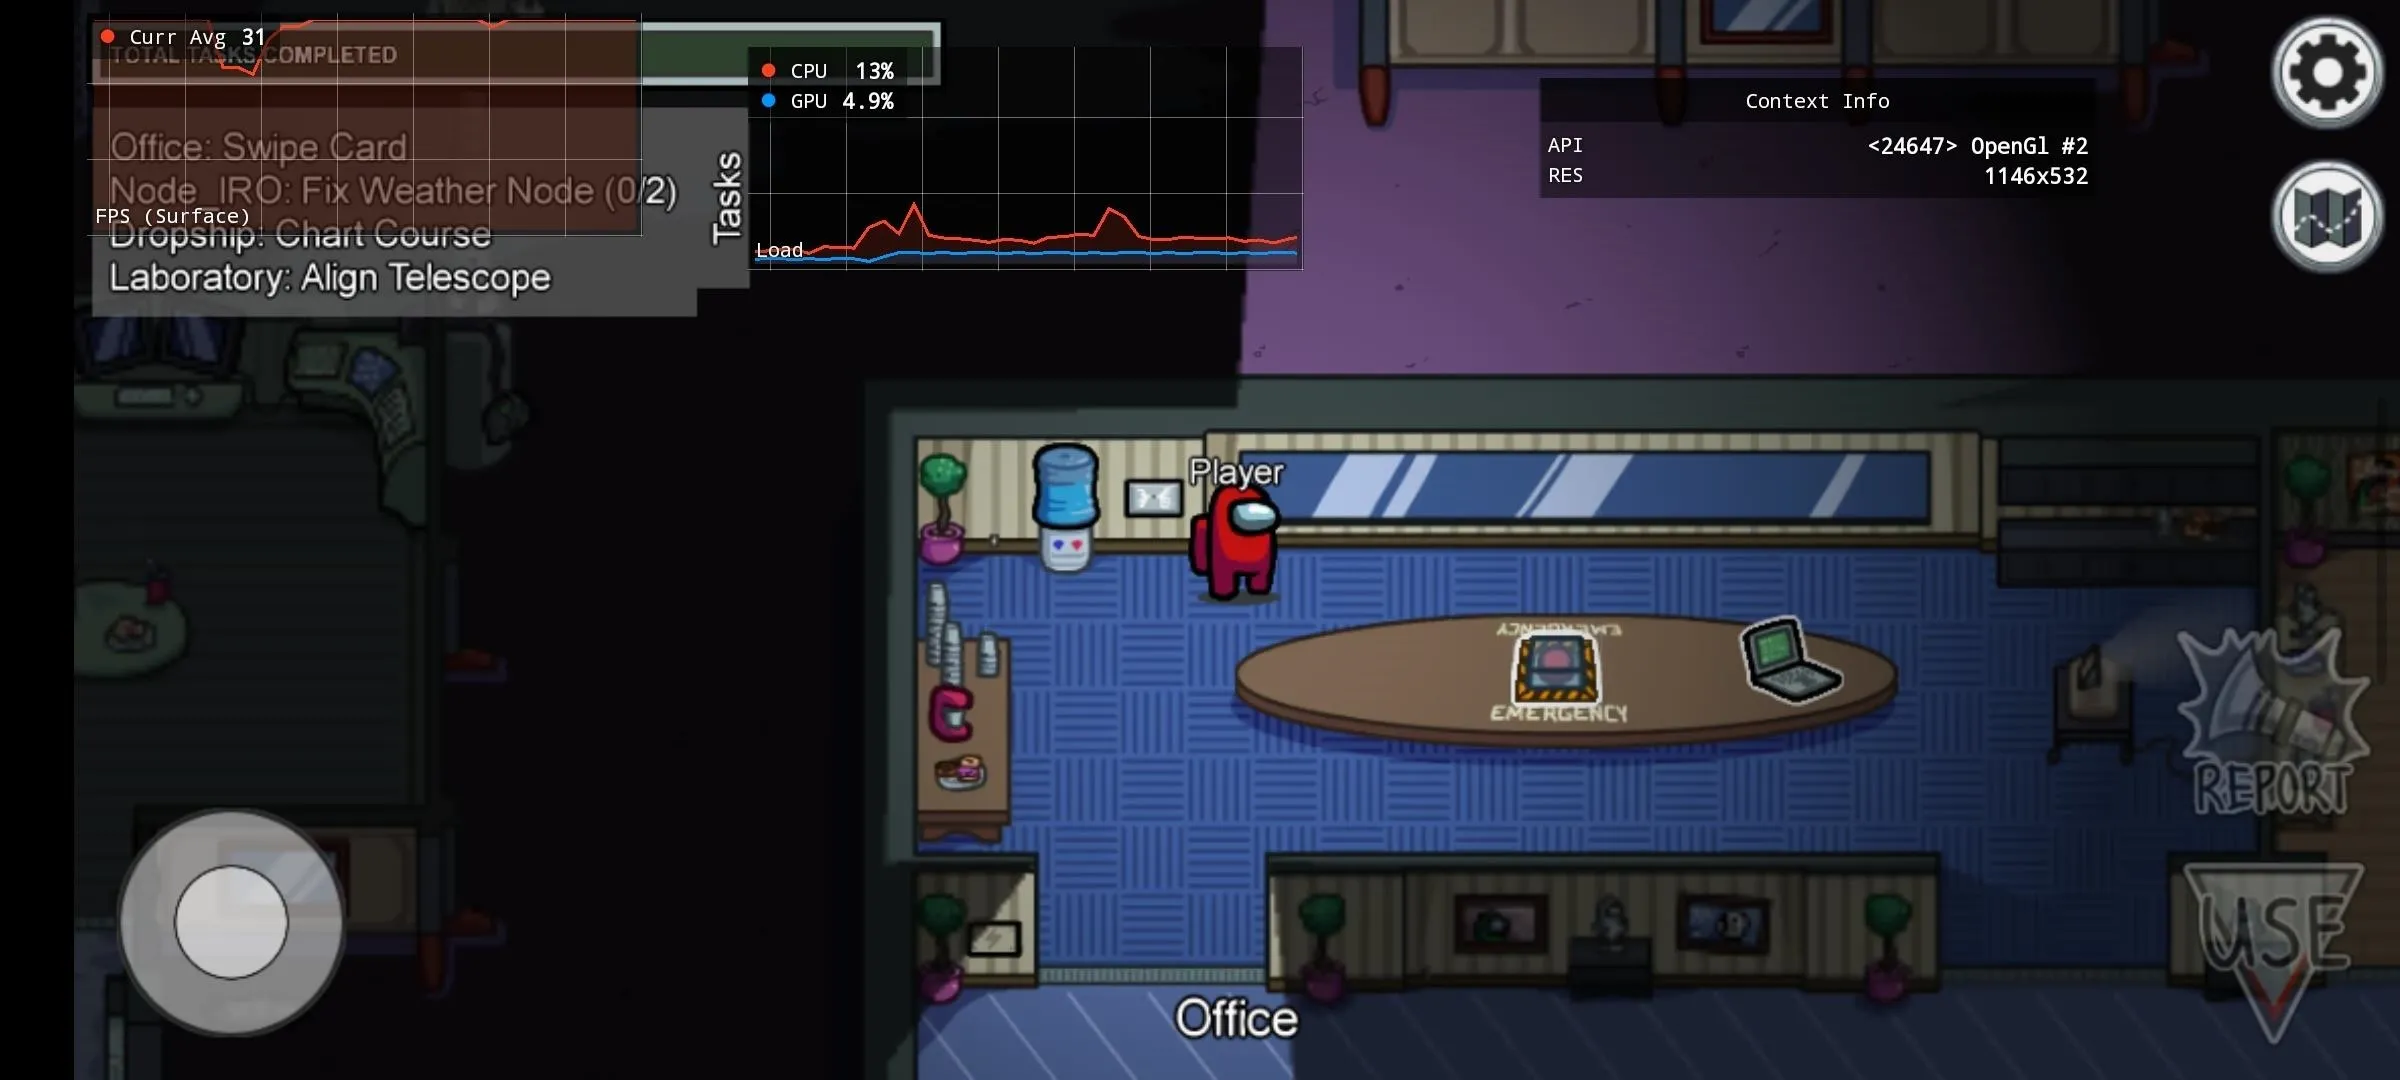
Cover image and screenshots by Jon Knight/Gadget Hacks








Comments
Be the first, drop a comment!